Open Pen in new window / View code as Gist
One of the most common questions we get from our WordPress VIP clients, many of whom are large media companies that publish constantly, is how they can bias their search results towards more recent content when scoring and sorting them. This type of problem is extremely hard to solve with a traditional RDBMS but we provide most of our VIP clients their own dedicated Elasticsearch index and as it happens ES comes with some powerful scoring functions for just this purpose.
With Elasticsearch adding date based weighting of results via function scores is pretty straightforward. A query like the following will multiply the TF-IDF textual relevancy score of the content with a date based score that makes older content less and less important as time progresses:
https://gist.github.com/xyu/305b55b385f9eafabd0fd09b81f3f0fe
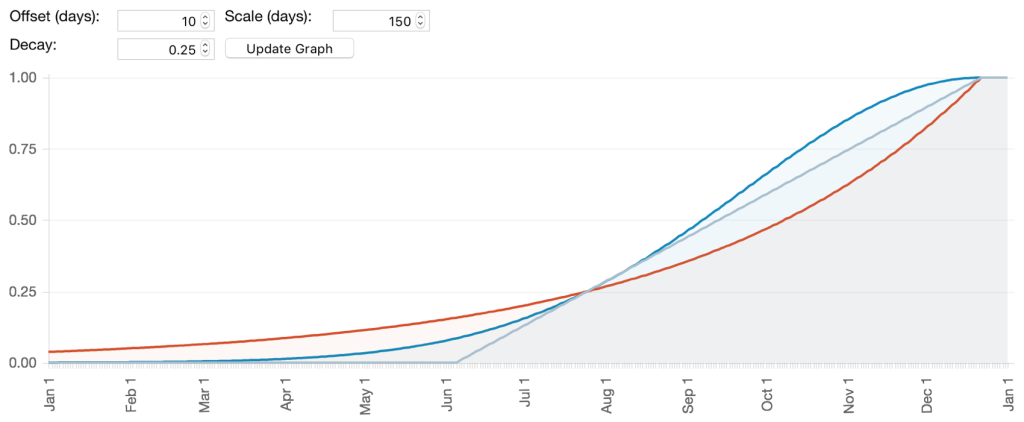
Adding such a time based decay is simple however it’s not obvious which type of function scoring should be used (gauss, exp, or linear) much less what are good values to use when configuring the offset, scale, and decay of each function.
While leading a workshop on querying Elasticsearch last week I struggled to explain exactly how these scoring functions will effect the final ranking of documents. So instead of trying to workout the coefficients we are adding with function scores by hand I decided to build a simple visualization so that it’s easier to play around with different settings to see what will happen to our scores under various settings.
The CodePen at the top of this post allows you to adjust various settings then shows how scores decay over a 1 year period with each of the three types of function scorers. Note, both offset and scale are specified in days so 28 is the equivalent of 28d when used within the ES query DSL.
4 responses to “Visualizing Elasticsearch Function Scores”
Did you look at the computational complexity / latency of the different functions? I would guess that Gaussian is probably the most computationally intensive, but the latency might not be that different, compared to http overhead and such.
I did not look at or test the computational complexity of each decay function in ES itself however I’ve implemented them in JS in order to make the visualization. The functions were transcribed from the ES docs on how scores are calculated. Indeed no matter how you slice it `gauss` is the most complex followed by `exp` with `linear` being the simplest. However I suspect for most use cases the computational time is negligible after factoring in TCP handshake time or even disk reads.
super awesome
Hi Xiao
The post is really useful. Is their any way to figure out the optimum values for decay and scale. I am generating the score based on distance and use gauss function.
Thank you